Title: Asymmetrical Linkages between Multi-frequency Atmospheric Waves and Variations in Winter PM2.5 Concentrations in Northern China during 2013–2019
Corresponding author: Wenyuan Chang (changwy@mail.iap.ac.cn)
Manuscript submitted to Journal of Geophysical Research
1. Data description:
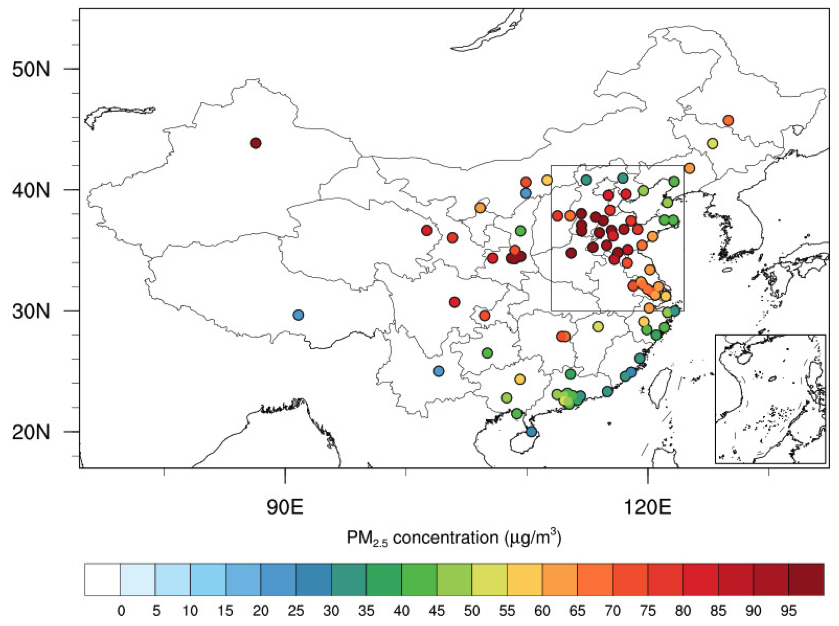
The page provides the instantaneous PM2.5 concentrations (ug/m3) at 103 cities in China at 06:00UTC (14:00 local time) for six winters (Oct-Mar) in 2013-2019 that are in use for the paper published in JGR (Manuscript number: JGR_MS2019JD031999R). The raw site data were downloaded from this website http://data.epmap.org. Each city has a few sites. The site PM2.5 were preprocessed in the following steps to attain the city PM2.5 in this page:
Remove the site that has missing values of more than 10% of the whole data records at this site over the six winters.
Average the instantaneous PM2.5 concentration, latitude and longitude at the reserving sites in each city.
Remove the city that has the continuous missing values more than three.
In the download link, the compressed file contains 36 files (pm25.yyyymm.txt), and each has the instantaneous PM2.5 concentration (ug/m3) at 06:00UTC in a month from October to March in 2013-2019. Each file has 103 rows for 103 cities and n columns indicating the number of days in that month. A file "zlonlat.txt" contains three columns, which are longitude, latitude, and the identification number of the city. The lon/lat of a city is the average lon/lat of the reserving sites in the city. After the three steps above, there are still a few missing values in the city PM2.5 data. I filled up these missing values with the interpolation values between the preceding and succeeding PM2.5 concentrations using the NCL function linmsg_n in a NCL script. One who uses this data need to handle these missing values by himself, and please acknowledge the original data source of China National Environmental Monitoring Center.
2. Missing values:
-99.
3. Download link


